Medical & Healthcare
 Cybersecurity
 Travel & Hospitality
 Edtech
 Enterprise
 Non-Profit
 Fintech
 Agritech
 Retail & Real Estate
 Design for AI
Designing CyberTiX’s Unified Platform for Smarter Threat Monitoring
CyberTiX, a product by Cygeniq, empowers enterprises to detect, investigate, and respond to threats from one unified platform. Built for industries managing large networks and sensitive data, like banking, finance, telecom, and government, the platform brings together real-time threat intelligence and system observability into a single, powerful interface.


Objective of Design
Our design goals for CyberTiX were shaped around day-to-day monitoring, not just incidents:
- Make the map obvious: Show which zone or segment needs attention before analysts even read a number.
- Separate noise from signal: Use layout and colour to highlight meaningful changes, not every tiny fluctuation.
- Link performance and security: Let teams see device health, traffic and threats in the same flow, instead of in separate tools.
- Support deep dives: Make it easy to move from a high-level view into detailed logs, assets and entities in a couple of clicks.
- Keep the system expandable: Design patterns that can absorb new widgets, views and data types without feeling bolted on.
Our Process

Pain Points
User Challenges
- Analysts struggled to connect data across tools to understand where threats were concentrated.
- Dense, text-heavy dashboards made it difficult to spot urgent patterns or relationships.
- Lack of hierarchy forced teams to spend extra time filtering and cross-referencing information.
Systemic Challenges:
- Fragmented monitoring across endpoints, applications, and networks slowed decision-making.
- Insights weren’t easily traceable to specific devices or sources, limiting investigative precision.
- Teams needed a way to visualize both immediate risks and long-term performance in one place.

Discovery
We collaborated with Cygeniq’s product and engineering teams to understand both user behavior and system capabilities.
- Research & Context Mapping: Mapped analyst workflows to identify decision points where clarity mattered most.
- Information Architecture: Reorganized threat data around zones and categories (endpoint, application, network) for intuitive scanning.
- Wireframe Testing: Conducted quick validation cycles to refine how visual hierarchy and radial layouts aided situational awareness.
- Design System Integration: Ensured consistency across CyberTiX and other Cygeniq products, like xVisor, for a cohesive ecosystem experience.

Implementation
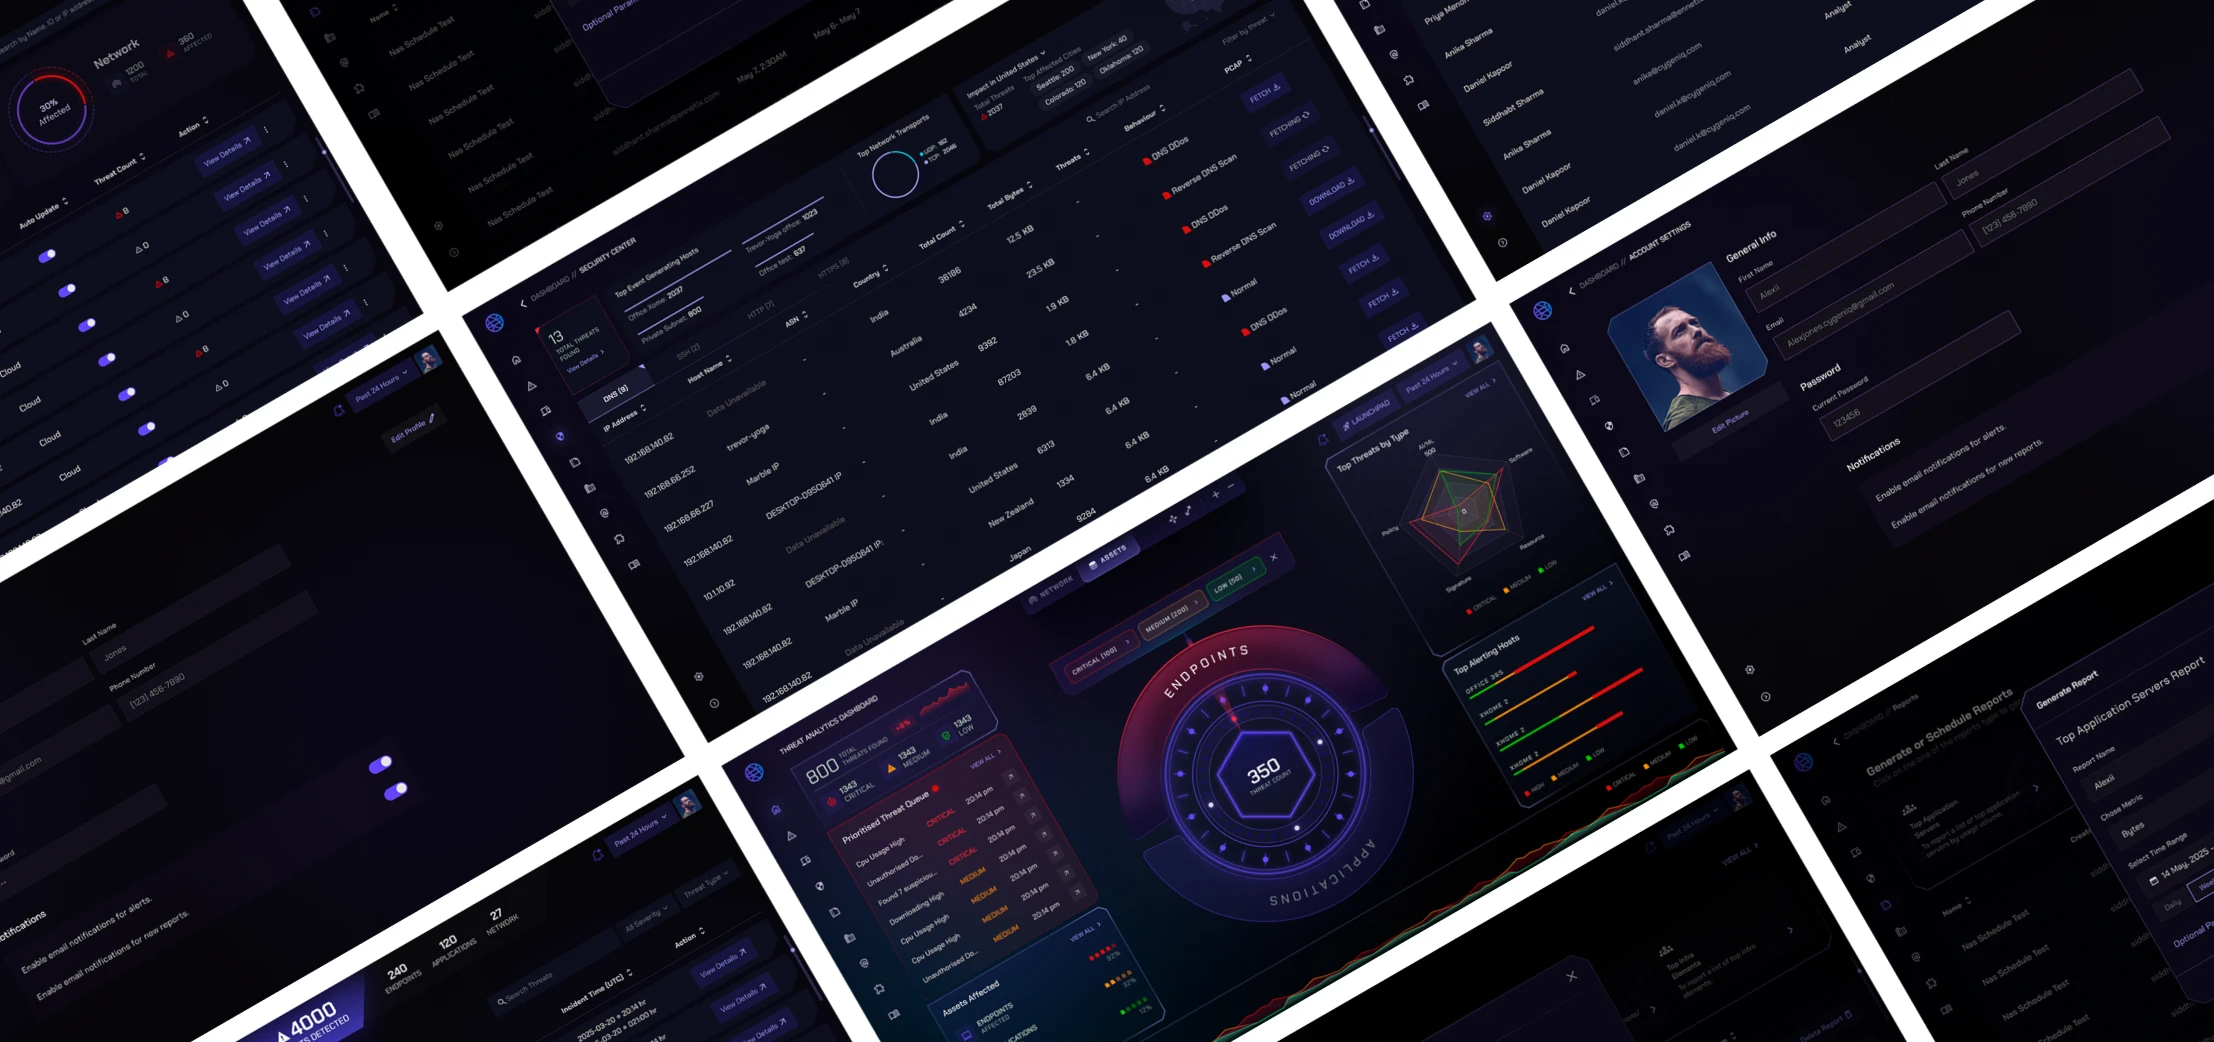
The final design transformed CyberTiX into an intuitive command center, one that mirrors the way analysts actually think and act.
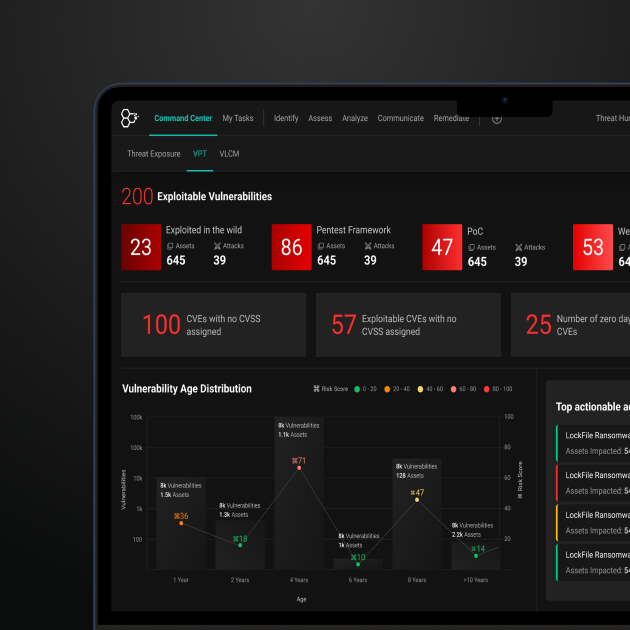
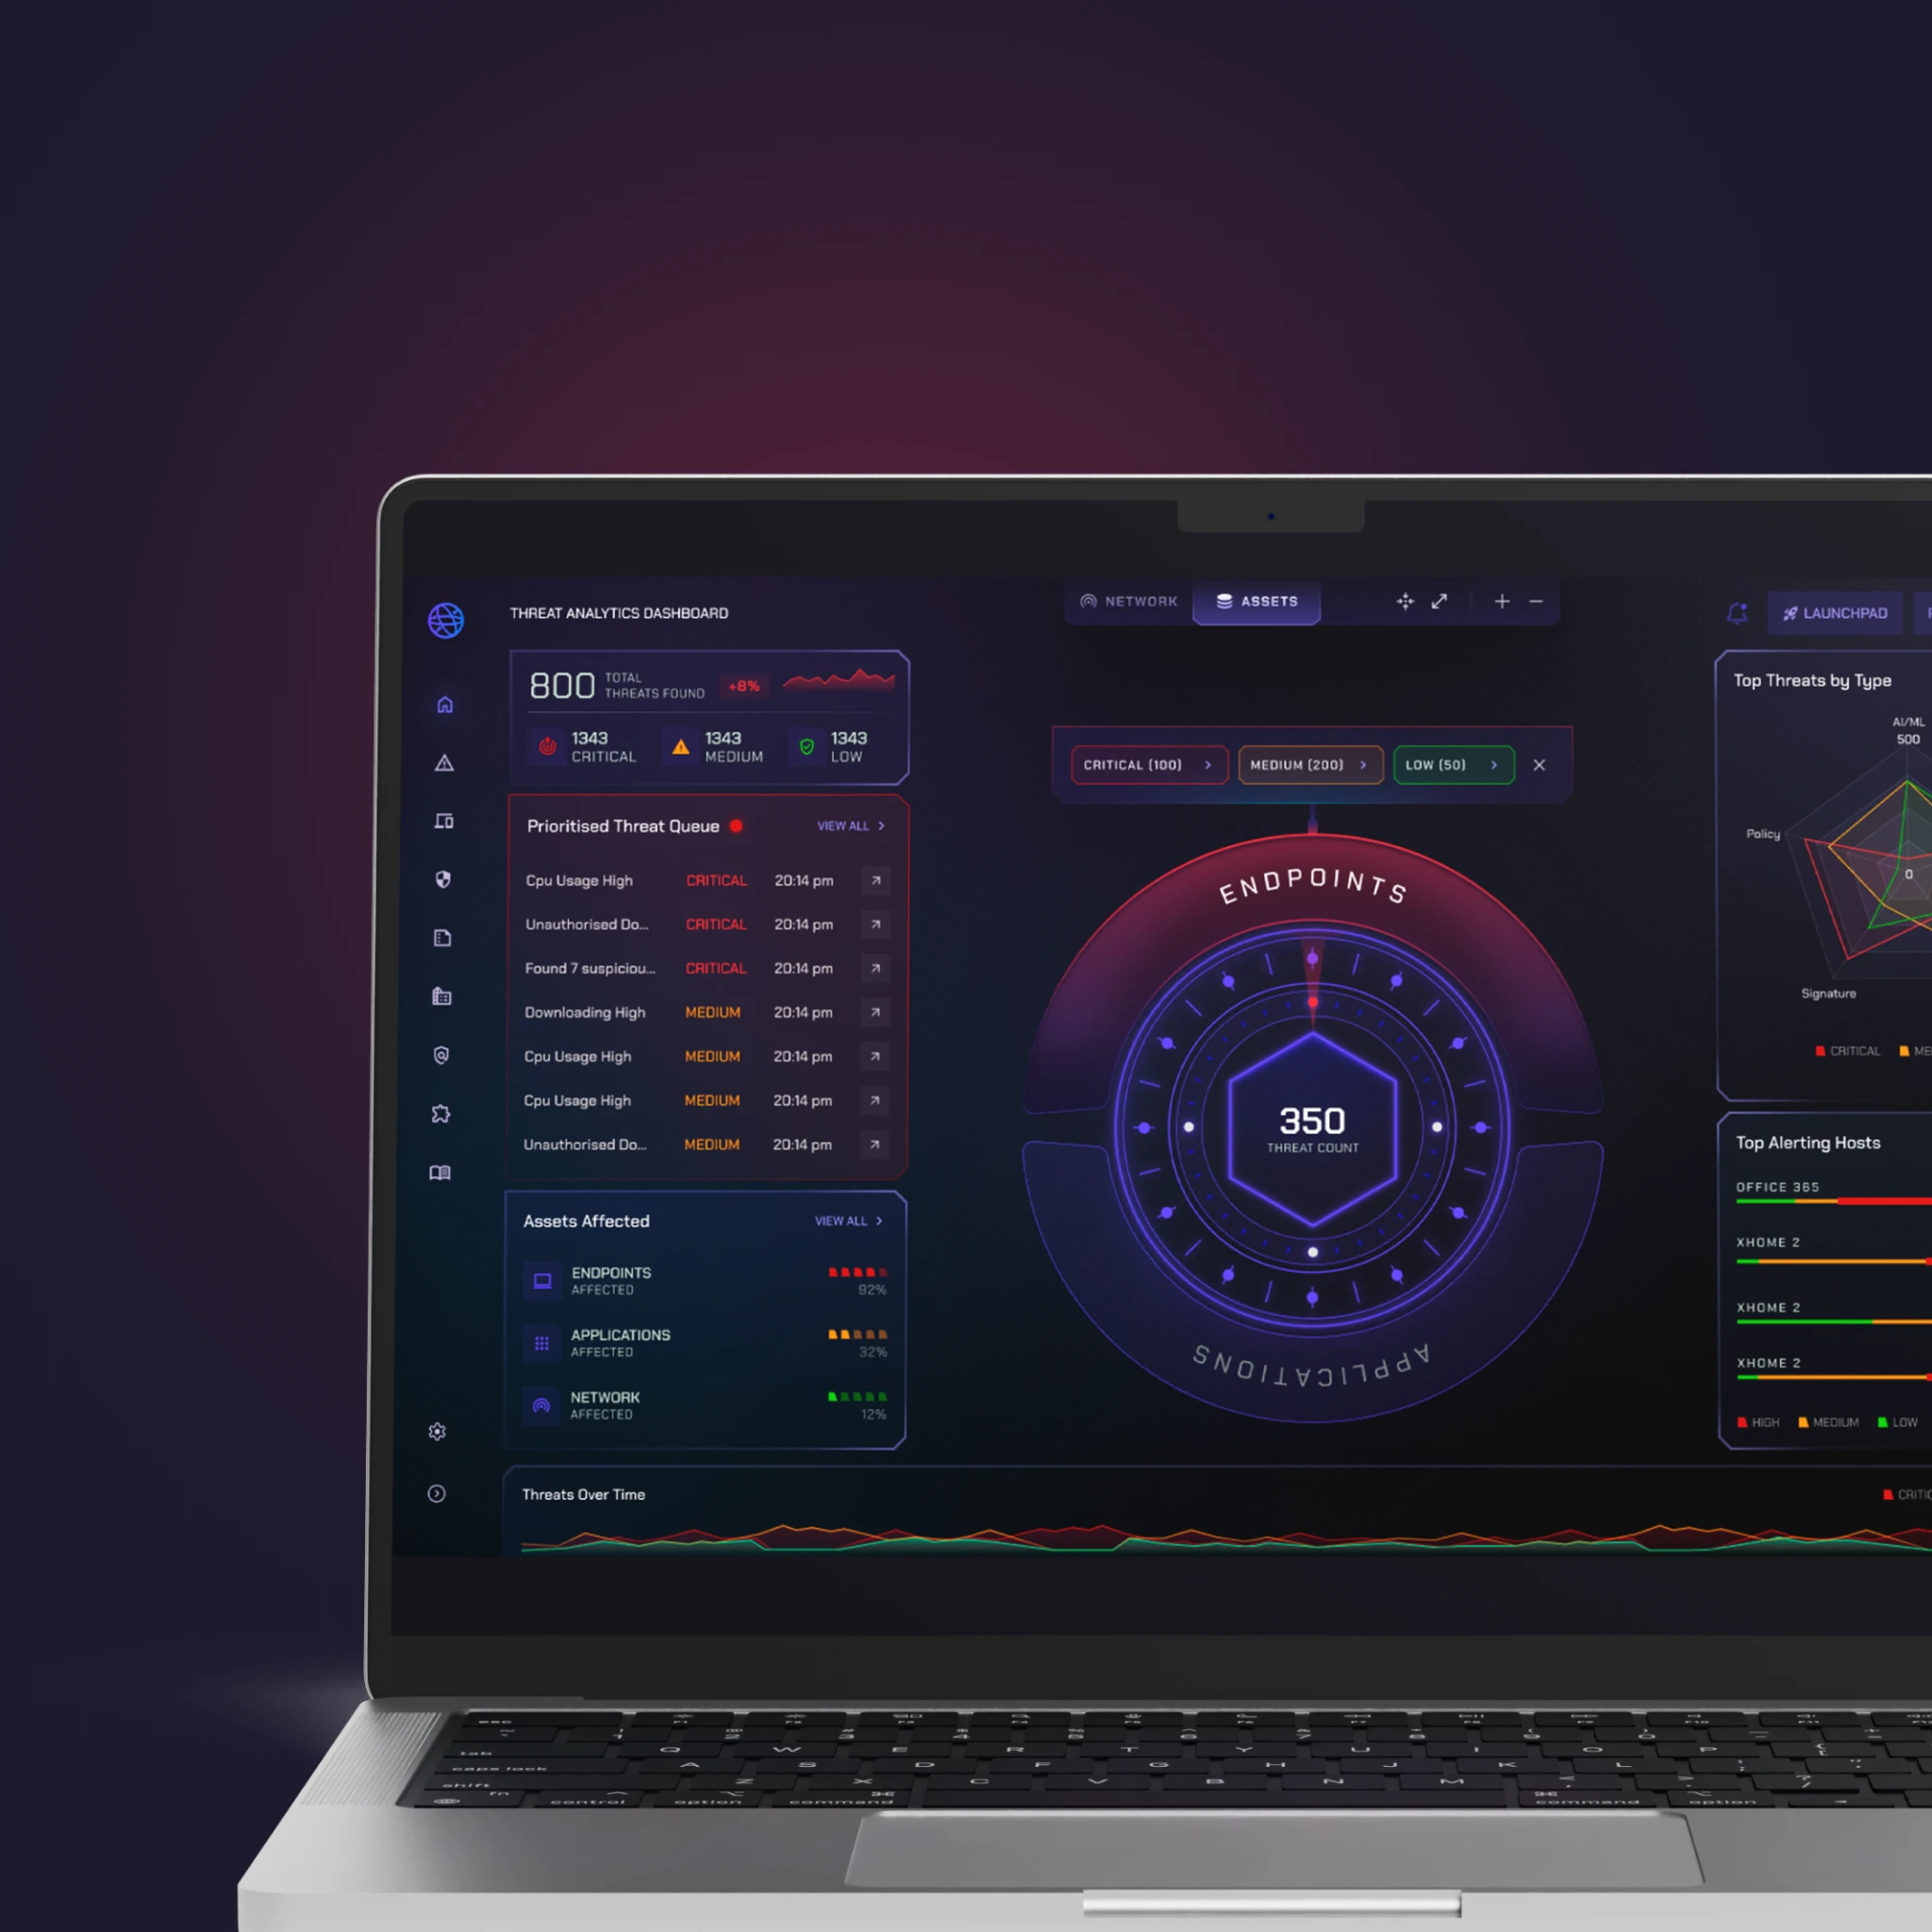
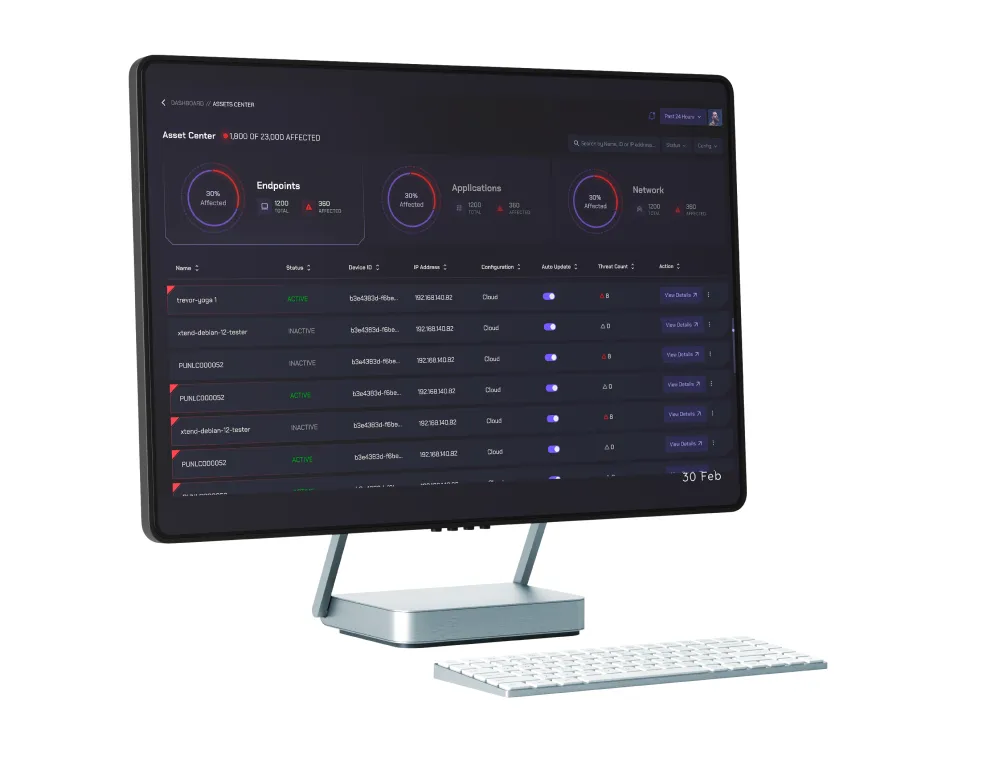
- Centralized Threat Visualization: A radial layout organizes threats by zone, giving teams an instant grasp of where critical risks lie.
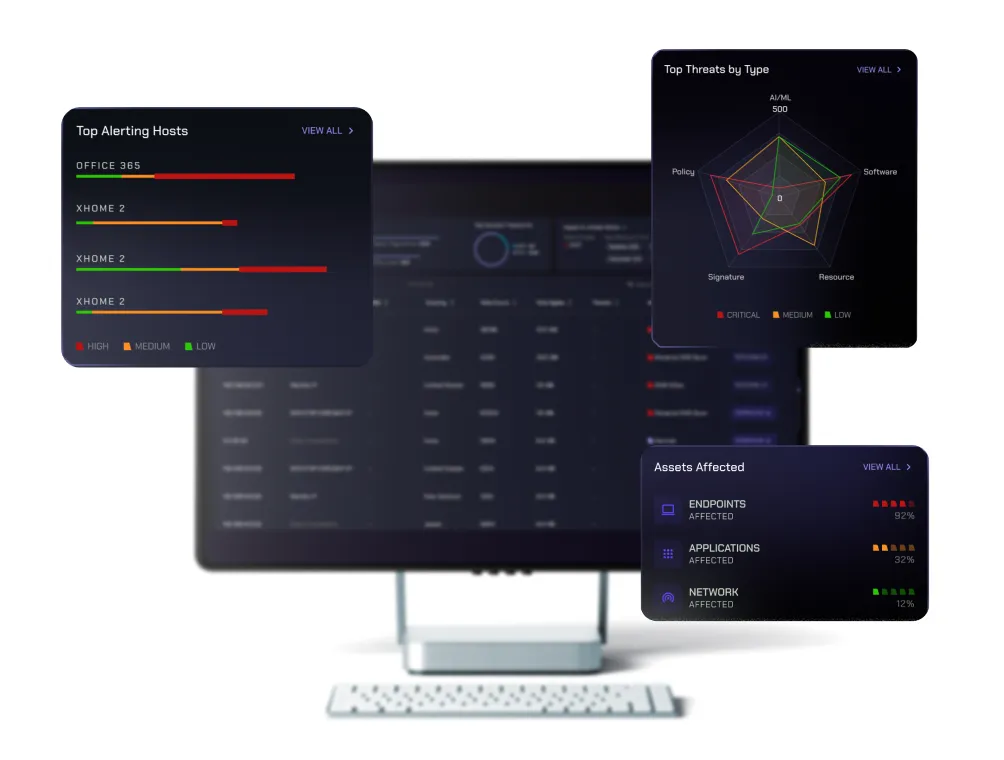
- Smart Alerting & Optimization: The Threat Analytics Dashboard provides prioritized queues and visual graphs to track assets affected, enabling faster triage.
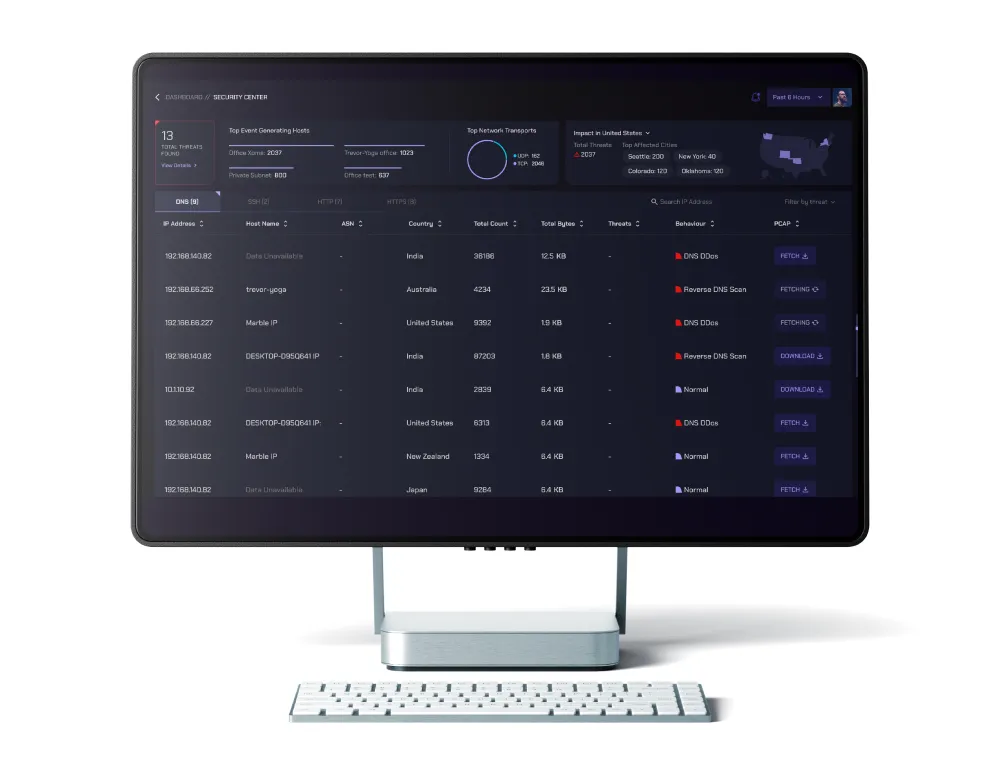
- Threat Categories Overview: Data grouped into Endpoint, Application, and Network views helps analysts trace sources and understand dependencies with clarity.
- Launchpad Dashboard: Combines all active insights, applications, threats, and policy violations, into one interactive view.
- Interactive Intelligence: Analysts can query the system directly to surface deeper insights, reducing time spent toggling across tools.
Outcomes
Outcomes
Team Monsoonfish partnered with Cygeniq to turn CyberTiX into a control center built around how analysts actually think and work. We restructured information architecture, streamlined navigation, and designed a visual language that connects performance, threat, and asset data into one cohesive view. The result is a workspace where analysts can watch, compare, and investigate activity across zones without losing context. The radial layout makes it easy to see where risk is rising, while categorized views for endpoints, networks, and applications reveal how each layer of infrastructure interacts.
By integrating multiple data streams into a single, visual system, CyberTiX now helps teams move faster, communicate better, and stay ahead of incidents. What was once a dense technical interface now feels like a live command center: built for awareness, collaboration, and control.
Helping Analysts See the Whole Picture With CyberTiX
Helping Analysts See the Whole Picture With CyberTiX
- Instead of juggling separate tools for performance, threats, and assets, analysts now follow a single storyline: where an issue starts, which systems are touched, and what has already been done. The radial map anchors that storyline, while the detailed views fill in evidence: logs, hosts, geography, and business impact.
- This makes handovers between shifts smoother, status reviews with leads simpler, and incident reviews less guess-based. CyberTiX doesn’t just display more data; it helps teams agree on what’s happening and what should happen next.
Impact
Business Impact
- Unified View: Reduced tool fragmentation by consolidating multiple dashboards into one cohesive system.
- Faster Decision-Making: Simplified visual hierarchy helped teams prioritize incidents 30–40% faster.
- Improved Platform Adoption: Clearer navigation and modular layouts encouraged broader usage across departments.
User Impact
- Sharper Situational Awareness: The radial threat map and categorized insights made it easier to identify where risks converge.
- Simpler Daily Operations: Analysts now access all critical metrics without jumping between screens.
- More Confident Responses: Real-time feedback loops and interactive insights build trust in the system’s reliability.
Let’s explore your project.
Book a free slot or share your email.
Or just share your email
We’ll reach out.
Other CASE STUDIES